
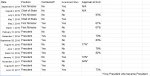
There has been some debate recently about the state of our executive elections. We have had many back-to-back uncontested elections, leading some to ask what's the cause, and how can we fix it? This article will not seek to answer those questions, but it will provide some data about uncontested elections, and their frequency. I have gone back and researched the last 16 executive elections, going back to June 2017, and found whether each election was contested or not, whether the incumbent ran, and what the winner's approval rating was at the end of the term. Here is that data:

As you can see, it breaks down like this:
16 Total Elections – Average Approval (11 Data Points) 77.8%
7 Uncontested – Average Approval (3 Data Points) 80.7%
9 Contested – Average Approval (8 Data Points) 76.8%
2 times the incumbent ran, it was uncontested, out 6 times the incumbent ran
As for our recent streak, we are currently in our longest period of uncontested elections in recent history, with four in a row. The interesting data here, I find, is that whether there is a contested election or not seems to have no real impact on the approval of the executive's term. There might be a slightly higher approval for uncontested election winners, but with only three data points it is hard to be conclusive. In addition, it would appear that an incumbent running is only a deterrent about a third of the time to candidates who would run in the same election. I hope that this data can shed some light onto the ongoing debate. If there are any polls I missed (did we really not poll the last Chief of State?) please let me know. Until next time, this is Calvin Coolidge, hoping we poll more.
Approval Rating Sources:
Term Starting July 2019
Term Starting May 2019
Term Starting March 2019
Term Starting December 2018
Term Starting September 2018
Term Starting August 2018
Term Starting June 2018
Term Starting March 2018
Term Starting January 2018
Term Starting November 2017
Term Starting June 2017
Attachments
Last edited: